ARTG 3451 Information Design I
Description
The course introduces basic concepts, methods, and procedures of information design with focus on mapping information. It investigates visual systems and information structures such as maps, graphs, charts, and diagrams. Emphasis is placed on the exploration of conceptual and visual solutions, and on the creative process of organizing, visualizing, and communicating information. The objective is to examine design solutions that make complex information easier to understand, and to use, by specific audiences. The course will be delivered as studio projects, individual and group critiques, lectures, discussions, and readings.
Learning Objectives
to develop basic critical language and procedures used in information design
to learn how to analyze, organize, visualize, and communicate information
to explore methods of research, design, and testing in the field of information design
to explore how to communicate complex information to a specific audience
Learning Outcomes
Students will be able to:
learn about the proper use of maps, charts, graphs, diagrams, comparative statistics, and tables
learn about mapping, wayfinding, and notation systems
give form to both qualitative and quantitative information
develop methods of collecting data from new and original sources
learn methods of gathering, interpreting, and curating existing bodies of data and research
formulate and test good design processes
evaluate their own work, and the work of their fellow students
Media usage (2017 and earlier)
Spend a period of seven days documenting your personal use of various kinds of media. Note at a minimum the number of individual uses, time spent, when, and what category the media falls into (list below). Design a diagram of your results.
Diagram of a complex process (Spring 2017, Fall 2017, Spring 2019)
Design a diagram or infographic that explains a complex process to a general audience. The process you choose should involve at least ten distinct steps. Use symbols, illustrations, and diagrams to make each step of the process clear.
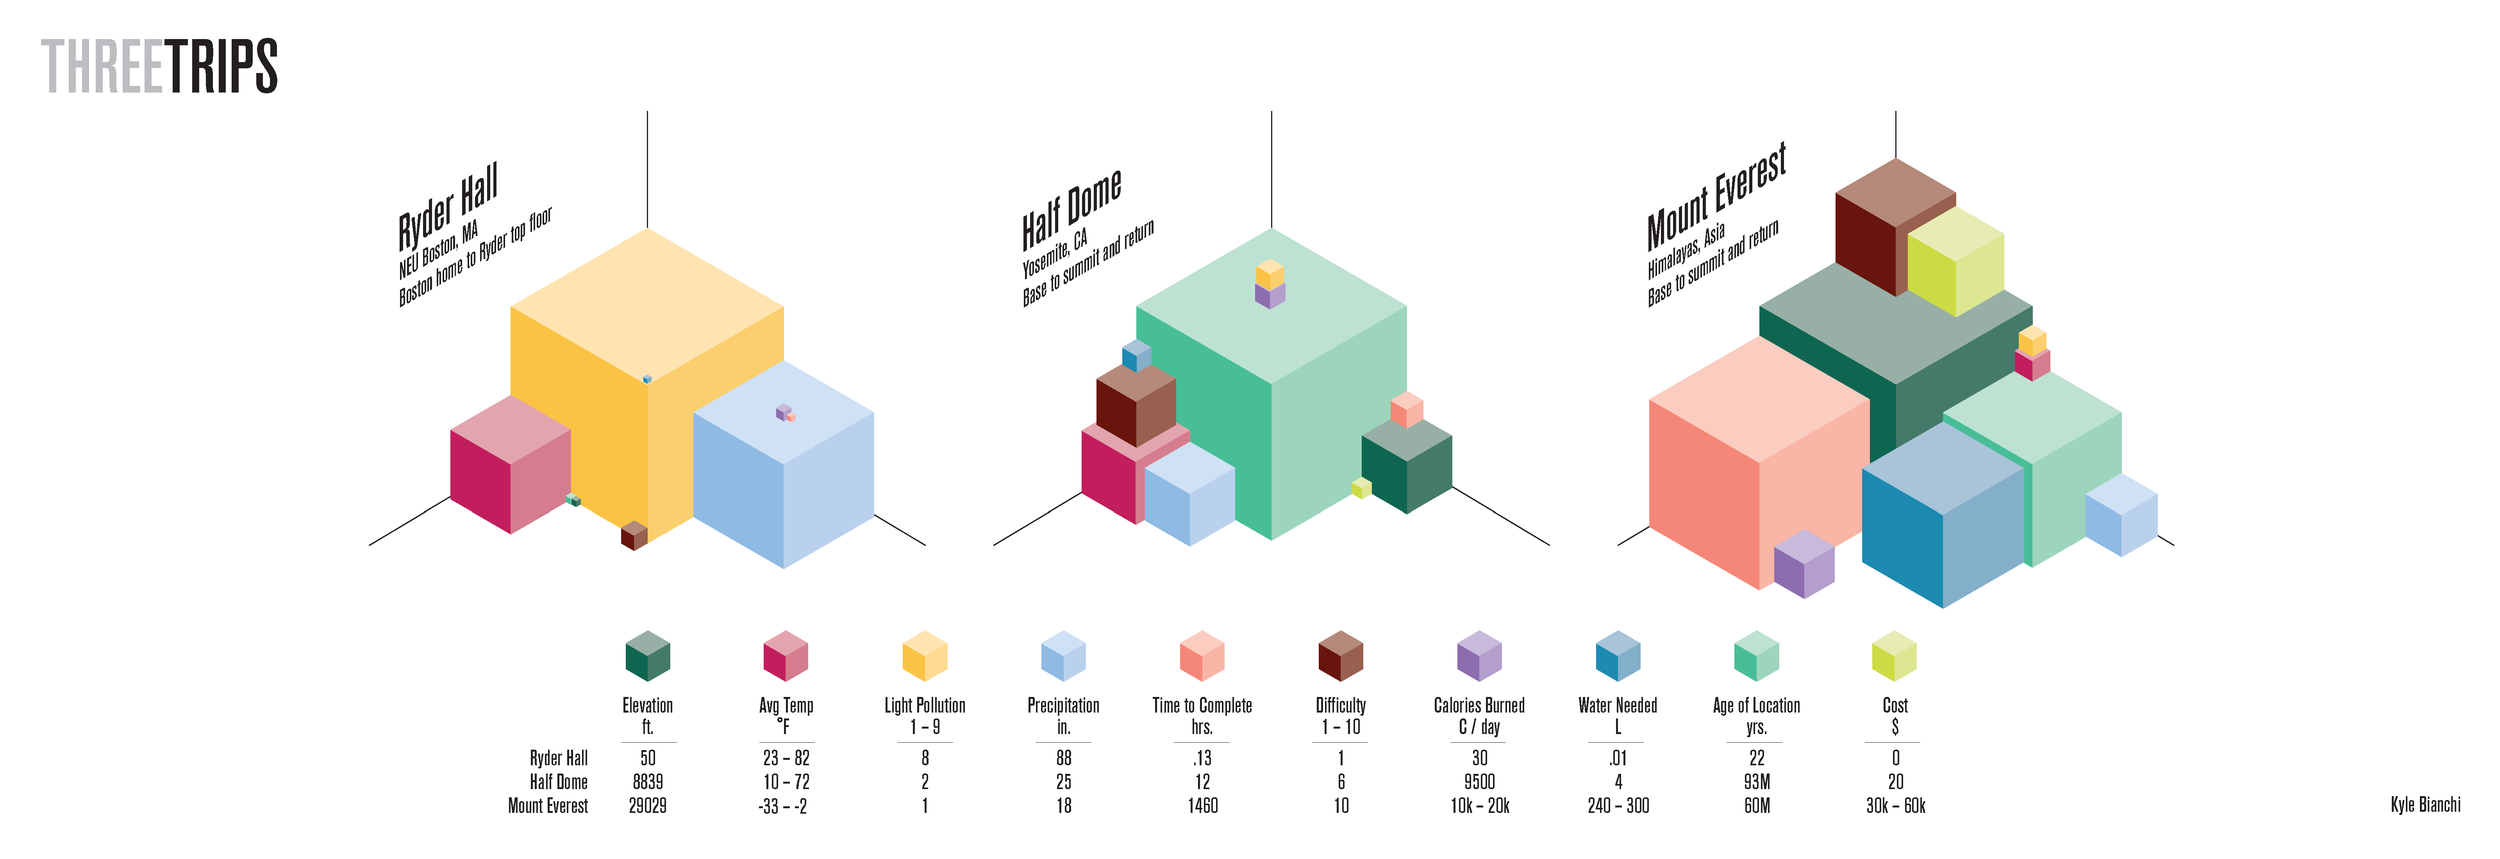
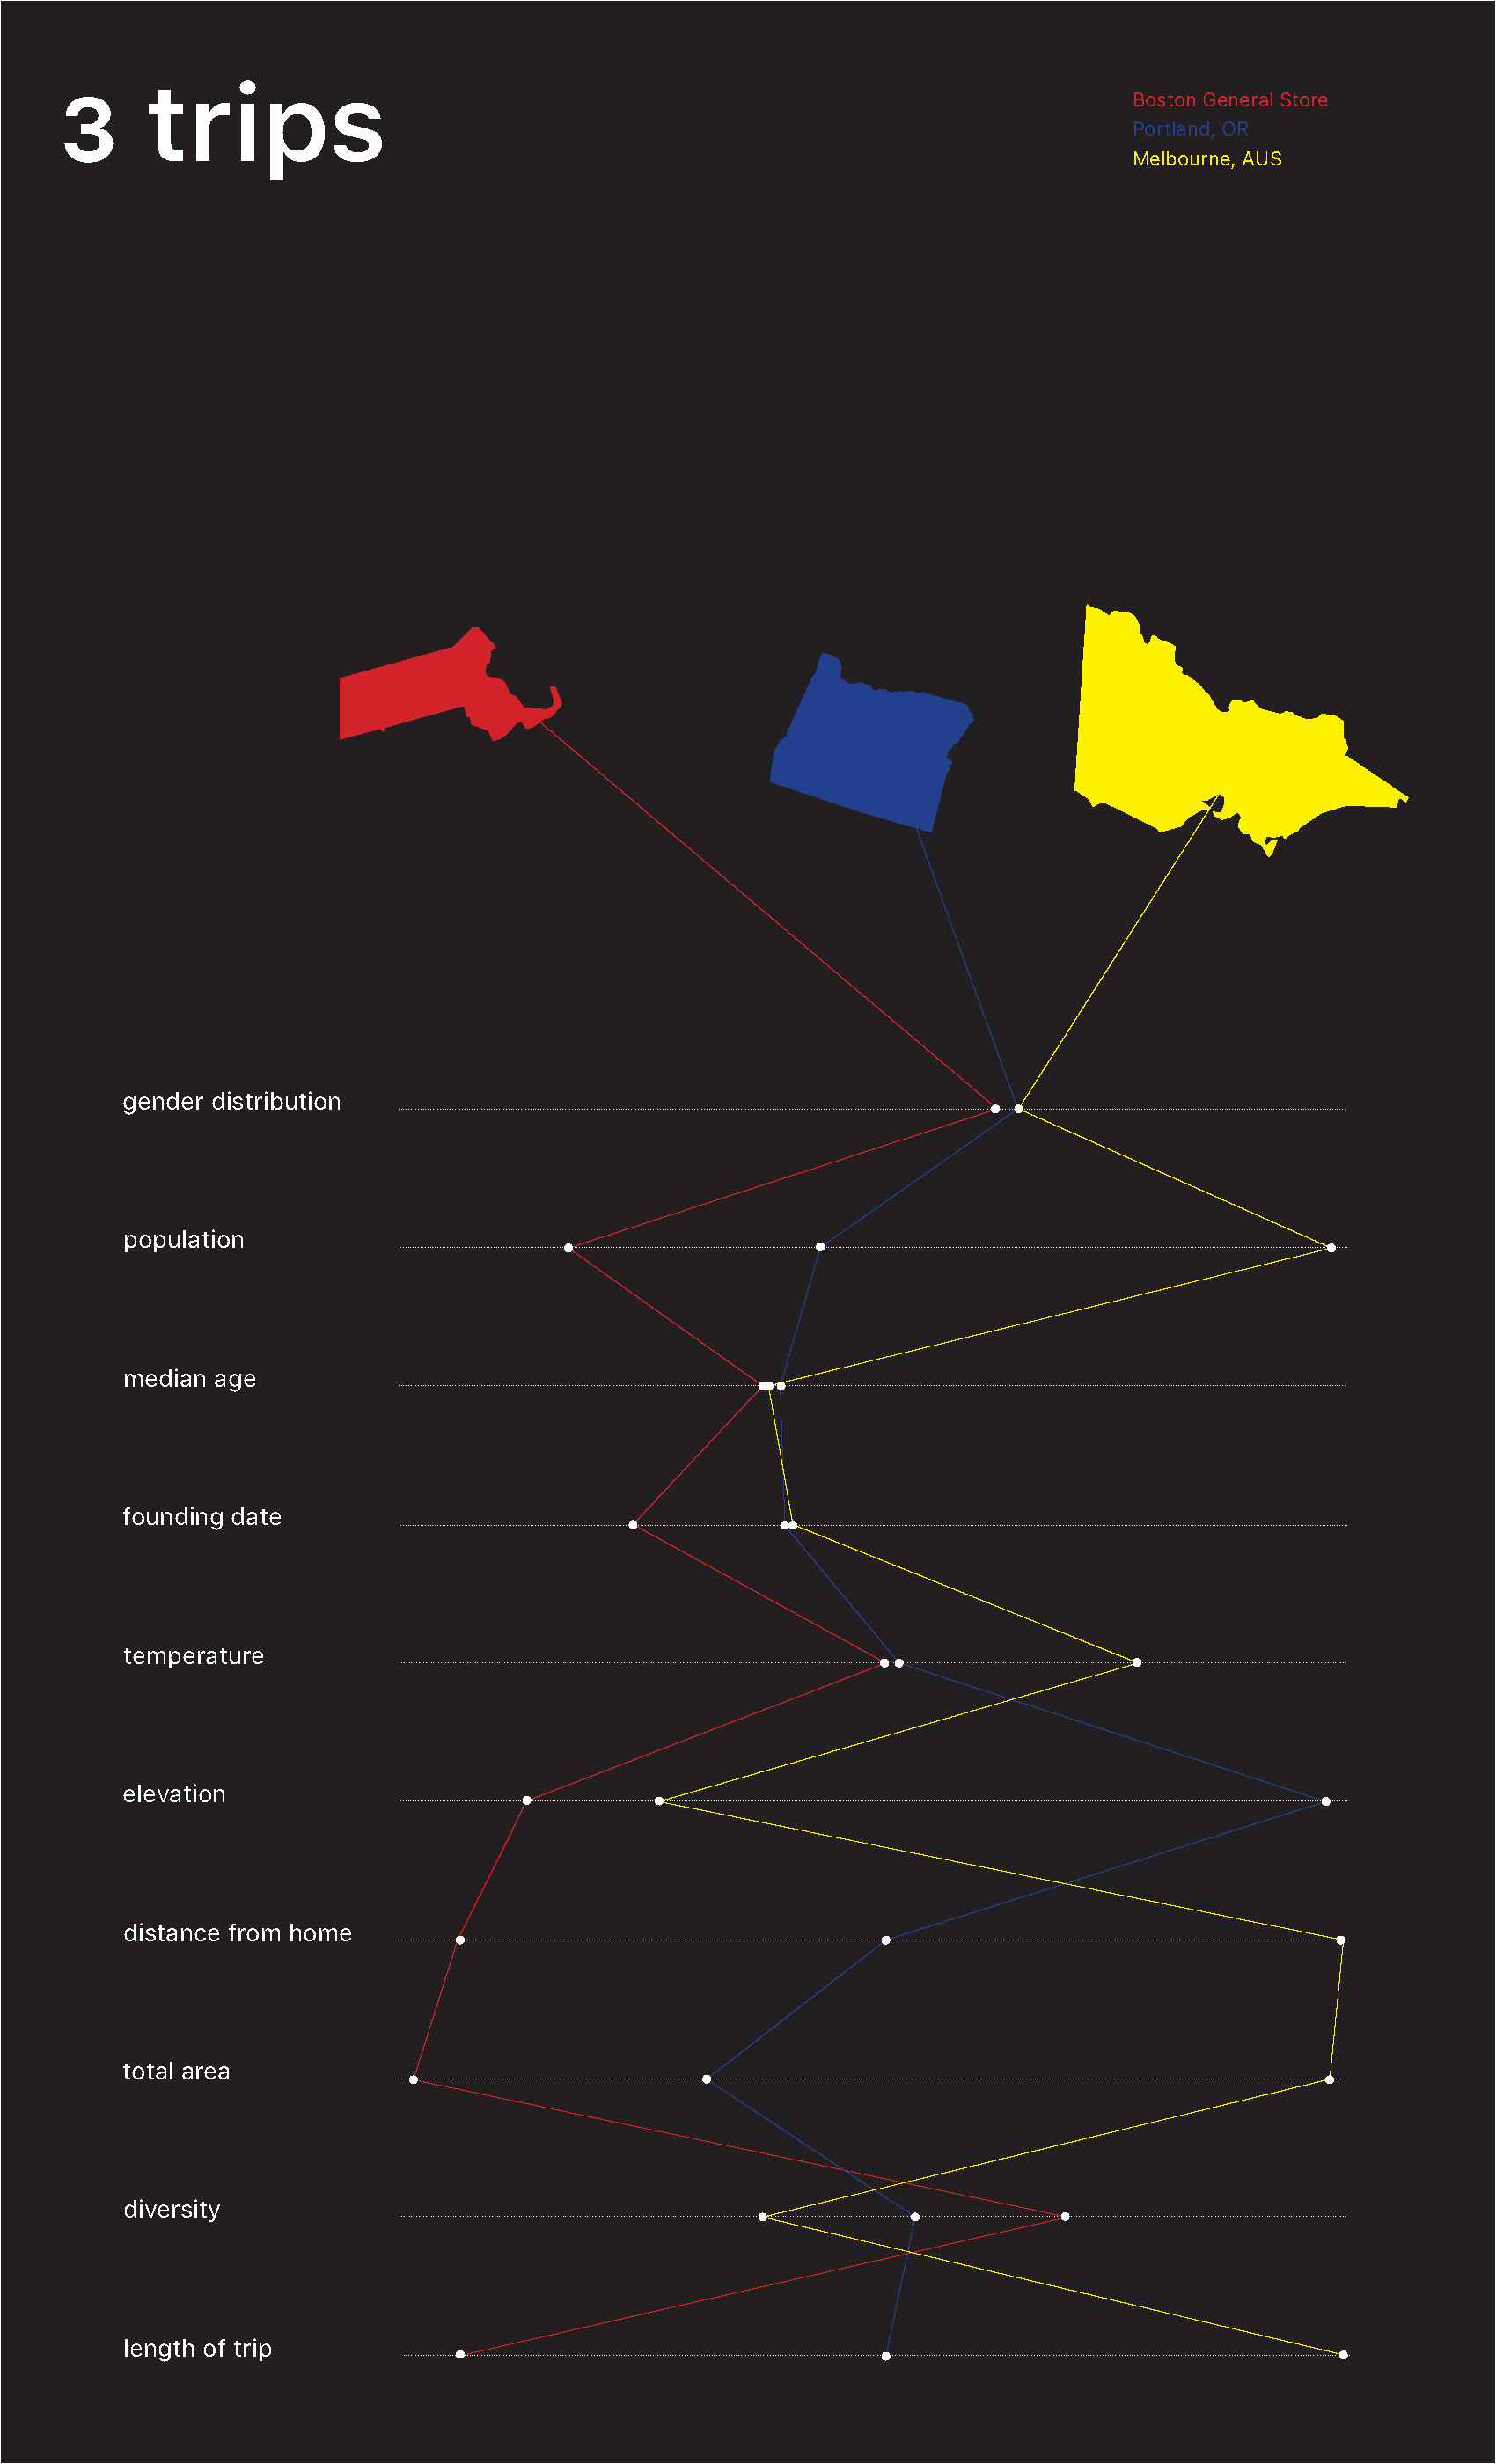
Map of three trips
Create single map or diagram documenting three trips you have taken or would like to take in the near future:
from your Boston living space to Ryder Hall
from Boston to a destination in North America (your choice)
from Boston to an overseas destination (your choice)
Use color, marks, and symbols to represent at least 10 distinct kinds of information across the three trips.
Country data
Design a visually coherent group of information graphics about an assigned country using diagrams, maps, charts, and iconography. Compile these into a visualization that communicates a larger economic, social, or environmental story of your choosing for the area.


